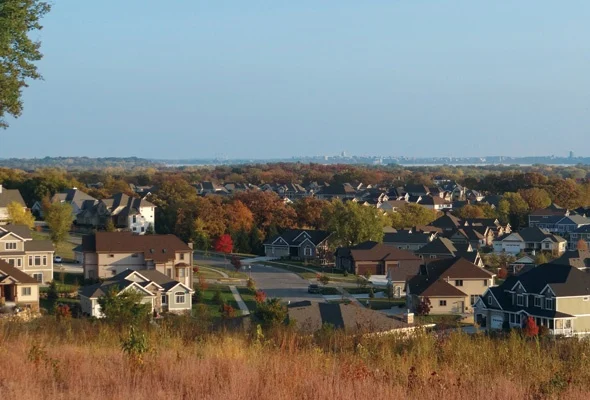
[Above, Dane County suburbs, from Channel3000, Mary Erpenbach]
This is a postscript to a previous post– “Will Madison ever say “Enough is Enough”? Probably not…”
Buried in the Clean Lakes Alliance’s latest report “Renew the Blue” is a subtle (albeit vague) admission that as Madison and Dane County grow and sprawl rampantly–and the amount of farmland shrinks–it will be increasingly challenging to control nutrient pollution to the lakes.
The Renew the Blue Executive Summary touts reductions in phosphorus runoff from farmland due to “best management practices”–but then oddly notes:
“Yet we also know it will take more than these current “Best Management Practices” alone to reach our water quality goals, and increased phosphorus loading is the proof.[1] With urban boundaries expanding to accommodate a rapidly growing population, the hardening of the landscape coupled with a shrinking rural land base is sure to magnify challenges in the years ahead. This means the more we can build soil health, reduce runoff, and address known sources of phosphorus and E. coli, the better the outlook for our lakes and surrounding communities.” (emphasis added)
Hmmm. This poses a paradox. How will we “build soil health” and “reduce runoff” while also “hardening the landscape” with more roads and buildings? While constructing more urban infrastructure, including storm drains that funnel polluted runoff quickly to the lakes?
As Madison grows outward and upward (today’s paper said at the current rate of growth, we can expect 70,000 more Madisonians by 2040!), and more land is “hardened” with concrete and other impervious materials, it will also be more and more of a stretch to place nearly all of the blame on farmers for nutrient pollution in the Yahara lakes (as CLA and other powers-that-be have to date).
Scientists recognized in the 1970s that urbanized areas would spew as much nutrient pollution (not to mention other toxic contaminants) into the lakes as farmland. “More urbanization takes farmland out of production,” UW professor of water chemistry, G. Fred Lee told the State Journal in 1973. “But the conversion of dairy manure to urban runoff doesn’t change the nutrients very much.”
*****
[1] Bizarrely, “Renew the Blue” blames “increased phosphorus loading” on increased rain and runoff in recent years. It confusingly claims that phosphorus and sediments entering Lake Mendota over the last 30 years have declined, and “conservation efforts would have resulted in a 36% decrease in phosphorus delivered…[i]f it were not for increased rainfall and runoff during this same period.”
What??? So all the phosphorus-reduction efforts (including CLA’s) haven’t actually resulted in reduced phosphorus inputs to the lakes? If not for more rain and runoff in the last 30 years, things would have improved–e.g., less phosphorus into the lakes? Am I interpreting this correctly?
Climate change may be to blame for more rain in recent decades, but perhaps rapid urban growth in the last 30 years also had something to do with the “increased runoff” and resulting “increased phosphorus loading”? Given that CLA is generously funded by several entities representing real estate and developers, of course the report isn’t going to openly state that.
***********
“Will Madison ever say “Enough is Enough”? Probably not…“
Madison cannot “have its cake and eat it too,” as the saying goes. Or maybe I should say “we can have our cake and we will eat it too”–but it will be poisoned cake?
On April 4, the Wisconsin State Journal reported that Madison is Wisconsin’s #1 fastest growing city. Surrounding municipalities are also on the top 20 fastest growing list: Sun Prairie #2, Fitchburg, #3, Middleton #5, Verona #8, Waunakee #11. The top 20 list is pasted at the end of this piece.
Another WSJ article on April 30 breathlessly touted rising home prices in Madison. “It’s an indication of strength of the local and regional economy and a thriving housing market,” city finance director David Schmiedicke told reporter Dean Mosiman.
Clearly, many people want to live in Madison—voted “best of” X, Y, Z in city contests year after year–but this growth comes at a big cost to the environment and community health. The brunt of the negative health effects will fall on—as usual—lower income people, including many people of color, who cannot afford the increasingly expensive homes here but find themselves living here anyway for many different reasons. As income disparities increase, more low income people will inevitably find themselves homeless, here in the “best of everything” city. It won’t be the “best” place for them.
And, with this level of growth, the quality of Madison and Dane County’s already polluted creeks, rivers and lakes can only trend in one direction–worse and worser. More polluted. No amount of retention ponds, rain gardens and other “green” design approaches can significantly change this trajectory. These and other engineering solutions may help take the edge off the damage, but they cannot prevent the most harmful impacts of more houses, roads, cars on our beloved Yahara lakes. There will be more impervious surfaces, more infrastructure, more pollution. This is indisputable.
Some people will suffer the brunt of these toxic growth downsides more than others. The already heavily polluted Yahara lakes will become more contaminated–as will the fish in them, consumed by many subsistence anglers, including many people of color.
Tens of thousands more residents in Madison (the city already grew by over 40,000 people from 2010 to 2020!) will also mean the Madison Water Utility will have more customers—which in turn means more water will be sucked up from the deep aquifers beneath the city. Madison’s municipal wells have already been pumping so much water over the decades that the hydrogeology of the area was reversed a long time ago; instead of springs feeding the lakes, the lakes are actually drawn downward into groundwater and pulled into municipal wells.
This heavy pumping also draws toxic pollutants from the surface–from industries, landfills, and other activities, and the lakes themselves—into our drinking water.
In sum, we are drinking our own toxic wastes. We are indeed having our toxic cake and eating it too, whether we know it or not.
Madison officials, citizens, and reporters used to publicly discuss this. What happened?
As described in a previous post, “Bigger is not Better,” in the past people publicly discussed the environmental and community health impacts of city growth. This was 52 years ago, when the city was much, much smaller. Here’s an excerpt:
In 1970, a Madison citizen activist, David Stewart with the Capital Community Citizens, publicly questioned the idea that “growth is good.” He asked why people played a secondary role to the automobile and airplanes. He criticized our “perverted sense of individualism” in which “everyone has the right to make money in land development regardless of the cost to the community.” He argued that bigger is not better– instead, he said, “more is less—less open space, less clean air, and less clean water.” He recommended “making an effort to build environmental considerations into every level of decision-making” and that we “enforce existing local and state pollution laws and write new ones to fill gaps and correct deficiencies.”
In 1978, as I described in Madison fouled its own nest, Part I, Capital Times journalist Daniel Allegretti wrote about the fact that the heavy municipal pumping was drawing down lake and other surface water, and 1990 he wrote about the first detections of toxic contaminants in drinking wells. (These chemicals had likely been there for some time, but went undetected because methods weren’t as sophisticated).
Sixteen years later, Wisconsin State Journal reporter Ron Seely wrote many articles (most in 2006 and 2007) that further detailed Madison’s growing well contamination and aquifer drawdown challenges as the city and county developed—e.g., “Houses go up, aquifer goes down” and more. See Part II of “Madison fouled its own nest” (not posted yet) for more examples of Seely’s excellent reporting.
Now, 16 years later, no local journalists are reporting on what this rampant growth could mean for our surface water quality, the aquifer under Madison and Dane County, and for our drinking water quality. Where are the local reporters now, the Dan Allegrettis and Ron Seelys of 2022?
Further, where are the public and political discussions about what this growth might mean for environmental and community health—including disparate impacts on low income and people of color, who will be less able to afford rising water bills (as more ratepayer-subsidized contaminant filters are needed for city wells) or install expensive water filters for their homes? They will more likely end up drinking contaminated water and eating contaminated fish than more privileged residents.
As the city grows and home prices rise, the lowest income people will have few choices but to live in “affordable” rental housing, often built over contaminated lands in the city (because it’s the least expensive land). Right now, Madison planners are planning to locate thousands of units over the highly contaminated former Oscar Mayer factory site.
Meanwhile, wealthier Madison residents will live in expensive luxury condos downtown or giant McMansions on the edges of the city or in suburbs.
In sum, race, class, and toxic exposure disparities will increase. Homelessness will increase.
As for the environmental and water quality impacts of this raging growth, have current city officials forgotten the lessons discussed by previous city leaders, and reported by journalists in the past? Or have they just accepted further environmental degradation and environmental justice impacts as the price of urban growth? Or are they dazed–starry-eyed drunk–with the prospect of more tax dollars?
What do current Madison residents think about this growth? What do low income residents who will not benefit from the growth, and will likely be harmed by it, think? Will there ever be a public discussion about this?
Will city leaders and residents ever say NO to more growth? Will they ever consider a limit?
My guess is–absolutely not. Even discussing this is verboten. For Madison, growth is a given.
As my mother frequently and infamously (but wisely) said to me and my seven siblings when we were engaged in idiotic, self-destructive behavior—“Enough is Enough!” In other words…
¡Ya basta! ¡Basta Ya!
But I’m sure Madison leaders don’t care one iota about what my mother used to say. And “enough is enough”–in English or Spanish–is apparently unspeakable to them…
***********
Top 20 fastest growing cities in Wisconsin
#1. Madison
– 2010 to 2020 population change: +40,604
— #73 among all cities nationwide
– 2010 to 2020 percent population change: 17.7%
— #149 among cities in Wisconsin, #6,200 among all cities nationwide
– 2020 population: 269,840
— #2 largest city in Wisconsin, #80 largest city nationwide
#2. Sun Prairie
– 2010 to 2020 population change: +8,159
— #643 among all cities nationwide
– 2010 to 2020 percent population change: 29.3%
— #70 among cities in Wisconsin, #3,924 among all cities nationwide
– 2020 population: 35,967
— #24 largest city in Wisconsin, #1,220 largest city nationwide
#3. Fitchburg
– 2010 to 2020 population change: +5,143
— #983 among all cities nationwide
– 2010 to 2020 percent population change: 21.0%
— #121 among cities in Wisconsin, #5,390 among all cities nationwide
– 2020 population: 29,609
— #27 largest city in Wisconsin, #1,512 largest city nationwide
#4. Windsor
– 2010 to 2020 population change: +4,881
— #1,042 among all cities nationwide
– 2010 to 2020 percent population change: 126.0%
— #5 among cities in Wisconsin, #636 among all cities nationwide
– 2020 population: 8,754
— #103 largest city in Wisconsin, #4,502 largest city nationwide
#5. Middleton
– 2010 to 2020 population change: +4,663
— #1,072 among all cities nationwide
– 2010 to 2020 percent population change: 27.2%
— #86 among cities in Wisconsin, #4,243 among all cities nationwide
– 2020 population: 21,827
— #37 largest city in Wisconsin, #2,088 largest city nationwide
#6. Eau Claire
– 2010 to 2020 population change: +4,288
— #1,156 among all cities nationwide
– 2010 to 2020 percent population change: 6.6%
— #310 among cities in Wisconsin, #10,623 among all cities nationwide
– 2020 population: 69,421
— #8 largest city in Wisconsin, #573 largest city nationwide
#7. Hobart
– 2010 to 2020 population change: +4,218
— #1,175 among all cities nationwide
– 2010 to 2020 percent population change: 70.4%
— #18 among cities in Wisconsin, #1,417 among all cities nationwide
– 2020 population: 10,211
— #90 largest city in Wisconsin, #3,989 largest city nationwide
#8. Verona
– 2010 to 2020 population change: +3,997
— #1,227 among all cities nationwide
– 2010 to 2020 percent population change: 39.8%
— #48 among cities in Wisconsin, #2,856 among all cities nationwide
– 2020 population: 14,030
— #64 largest city in Wisconsin, #3,095 largest city nationwide
#9. Green Bay
– 2010 to 2020 population change: +3,435
— #1,389 among all cities nationwide
– 2010 to 2020 percent population change: 3.3%
— #388 among cities in Wisconsin, #12,718 among all cities nationwide
– 2020 population: 107,395
— #3 largest city in Wisconsin, #302 largest city nationwide
#10. Oak Creek
– 2010 to 2020 population change: +3,428
— #1,393 among all cities nationwide
– 2010 to 2020 percent population change: 10.4%
— #243 among cities in Wisconsin, #8,709 among all cities nationwide
– 2020 population: 36,497
— #23 largest city in Wisconsin, #1,204 largest city nationwide
#11. Waunakee
– 2010 to 2020 population change: +3,322
— #1,438 among all cities nationwide
– 2010 to 2020 percent population change: 28.7%
— #74 among cities in Wisconsin, #4,011 among all cities nationwide
– 2020 population: 14,879
— #59 largest city in Wisconsin, #2,947 largest city nationwide
#12. Menomonee Falls
– 2010 to 2020 population change: +3,306
— #1,448 among all cities nationwide
– 2010 to 2020 percent population change: 9.4%
— #258 among cities in Wisconsin, #9,172 among all cities nationwide
– 2020 population: 38,527
— #19 largest city in Wisconsin, #1,138 largest city nationwide
#13. Brookfield
– 2010 to 2020 population change: +3,266
— #1,461 among all cities nationwide
– 2010 to 2020 percent population change: 8.6%
— #267 among cities in Wisconsin, #9,574 among all cities nationwide
– 2020 population: 41,464
— #16 largest city in Wisconsin, #1,047 largest city nationwide
#14. Howard
– 2010 to 2020 population change: +3,215
— #1,495 among all cities nationwide
– 2010 to 2020 percent population change: 19.2%
— #134 among cities in Wisconsin, #5,806 among all cities nationwide
– 2020 population: 19,950
— #41 largest city in Wisconsin, #2,261 largest city nationwide
#15. Appleton
– 2010 to 2020 population change: +3,024
— #1,572 among all cities nationwide
– 2010 to 2020 percent population change: 4.2%
— #364 among cities in Wisconsin, #12,156 among all cities nationwide
– 2020 population: 75,644
— #6 largest city in Wisconsin, #508 largest city nationwide
#16. Pewaukee
– 2010 to 2020 population change: +2,951
— #1,605 among all cities nationwide
– 2010 to 2020 percent population change: 22.8%
— #108 among cities in Wisconsin, #5,012 among all cities nationwide
– 2020 population: 15,914
— #54 largest city in Wisconsin, #2,788 largest city nationwide
#17. Oconomowoc
– 2010 to 2020 population change: +2,938
— #1,610 among all cities nationwide
– 2010 to 2020 percent population change: 19.2%
— #133 among cities in Wisconsin, #5,795 among all cities nationwide
– 2020 population: 18,203
— #47 largest city in Wisconsin, #2,473 largest city nationwide
#18. Franklin
– 2010 to 2020 population change: +2,758
— #1,680 among all cities nationwide
– 2010 to 2020 percent population change: 8.1%
— #275 among cities in Wisconsin, #9,802 among all cities nationwide
– 2020 population: 36,816
— #21 largest city in Wisconsin, #1,193 largest city nationwide
#19. Bristol
– 2010 to 2020 population change: +2,629
— #1,744 among all cities nationwide
– 2010 to 2020 percent population change: 102.6%
— #9 among cities in Wisconsin, #834 among all cities nationwide
– 2020 population: 5,192
— #146 largest city in Wisconsin, #6,383 largest city nationwide
#20. Hudson
– 2010 to 2020 population change: +2,422
— #1,860 among all cities nationwide
– 2010 to 2020 percent population change: 19.6%
— #130 among cities in Wisconsin, #5,711 among all cities nationwide
– 2020 population: 14,755
— #61 largest city in Wisconsin, #2,967 largest city nationwide
