At a March 19, 2014 community presentation, Madison-Kipp Corporation’s CEO Tony Koblinski presented Kipp pollution maps and invited citizens to view them after his talk, noting that “when you get a chance to look at the data, you’ll be able to see all the values on each of those.” But when MEJO President began to photograph maps after the presentation, Mr. Koblinski rushed over to intervene, hurriedly turning them over to the white side. “These aren’t quite ready for prime time!” he said, obviously highly agitated. “They’ll be in the public record, in the Annual Report, in two or three weeks.”
It was very awkward behavior for a corporate CEO in a public venue—and especially ironic given he stated in the opening of his talk that Kipp wants to “reestablish Kipp’s reputation and standing” and “communicate openly with our neighbors” in an “honest and open dialogue.” (Mr. Koblinski’s presentation was likely written and carefully vetted by Kipp’s law firm, Michael Best & Friedrich.)
Why would Kipp present maps at a public meeting, invite people to view them, but not allow them to take photographs?
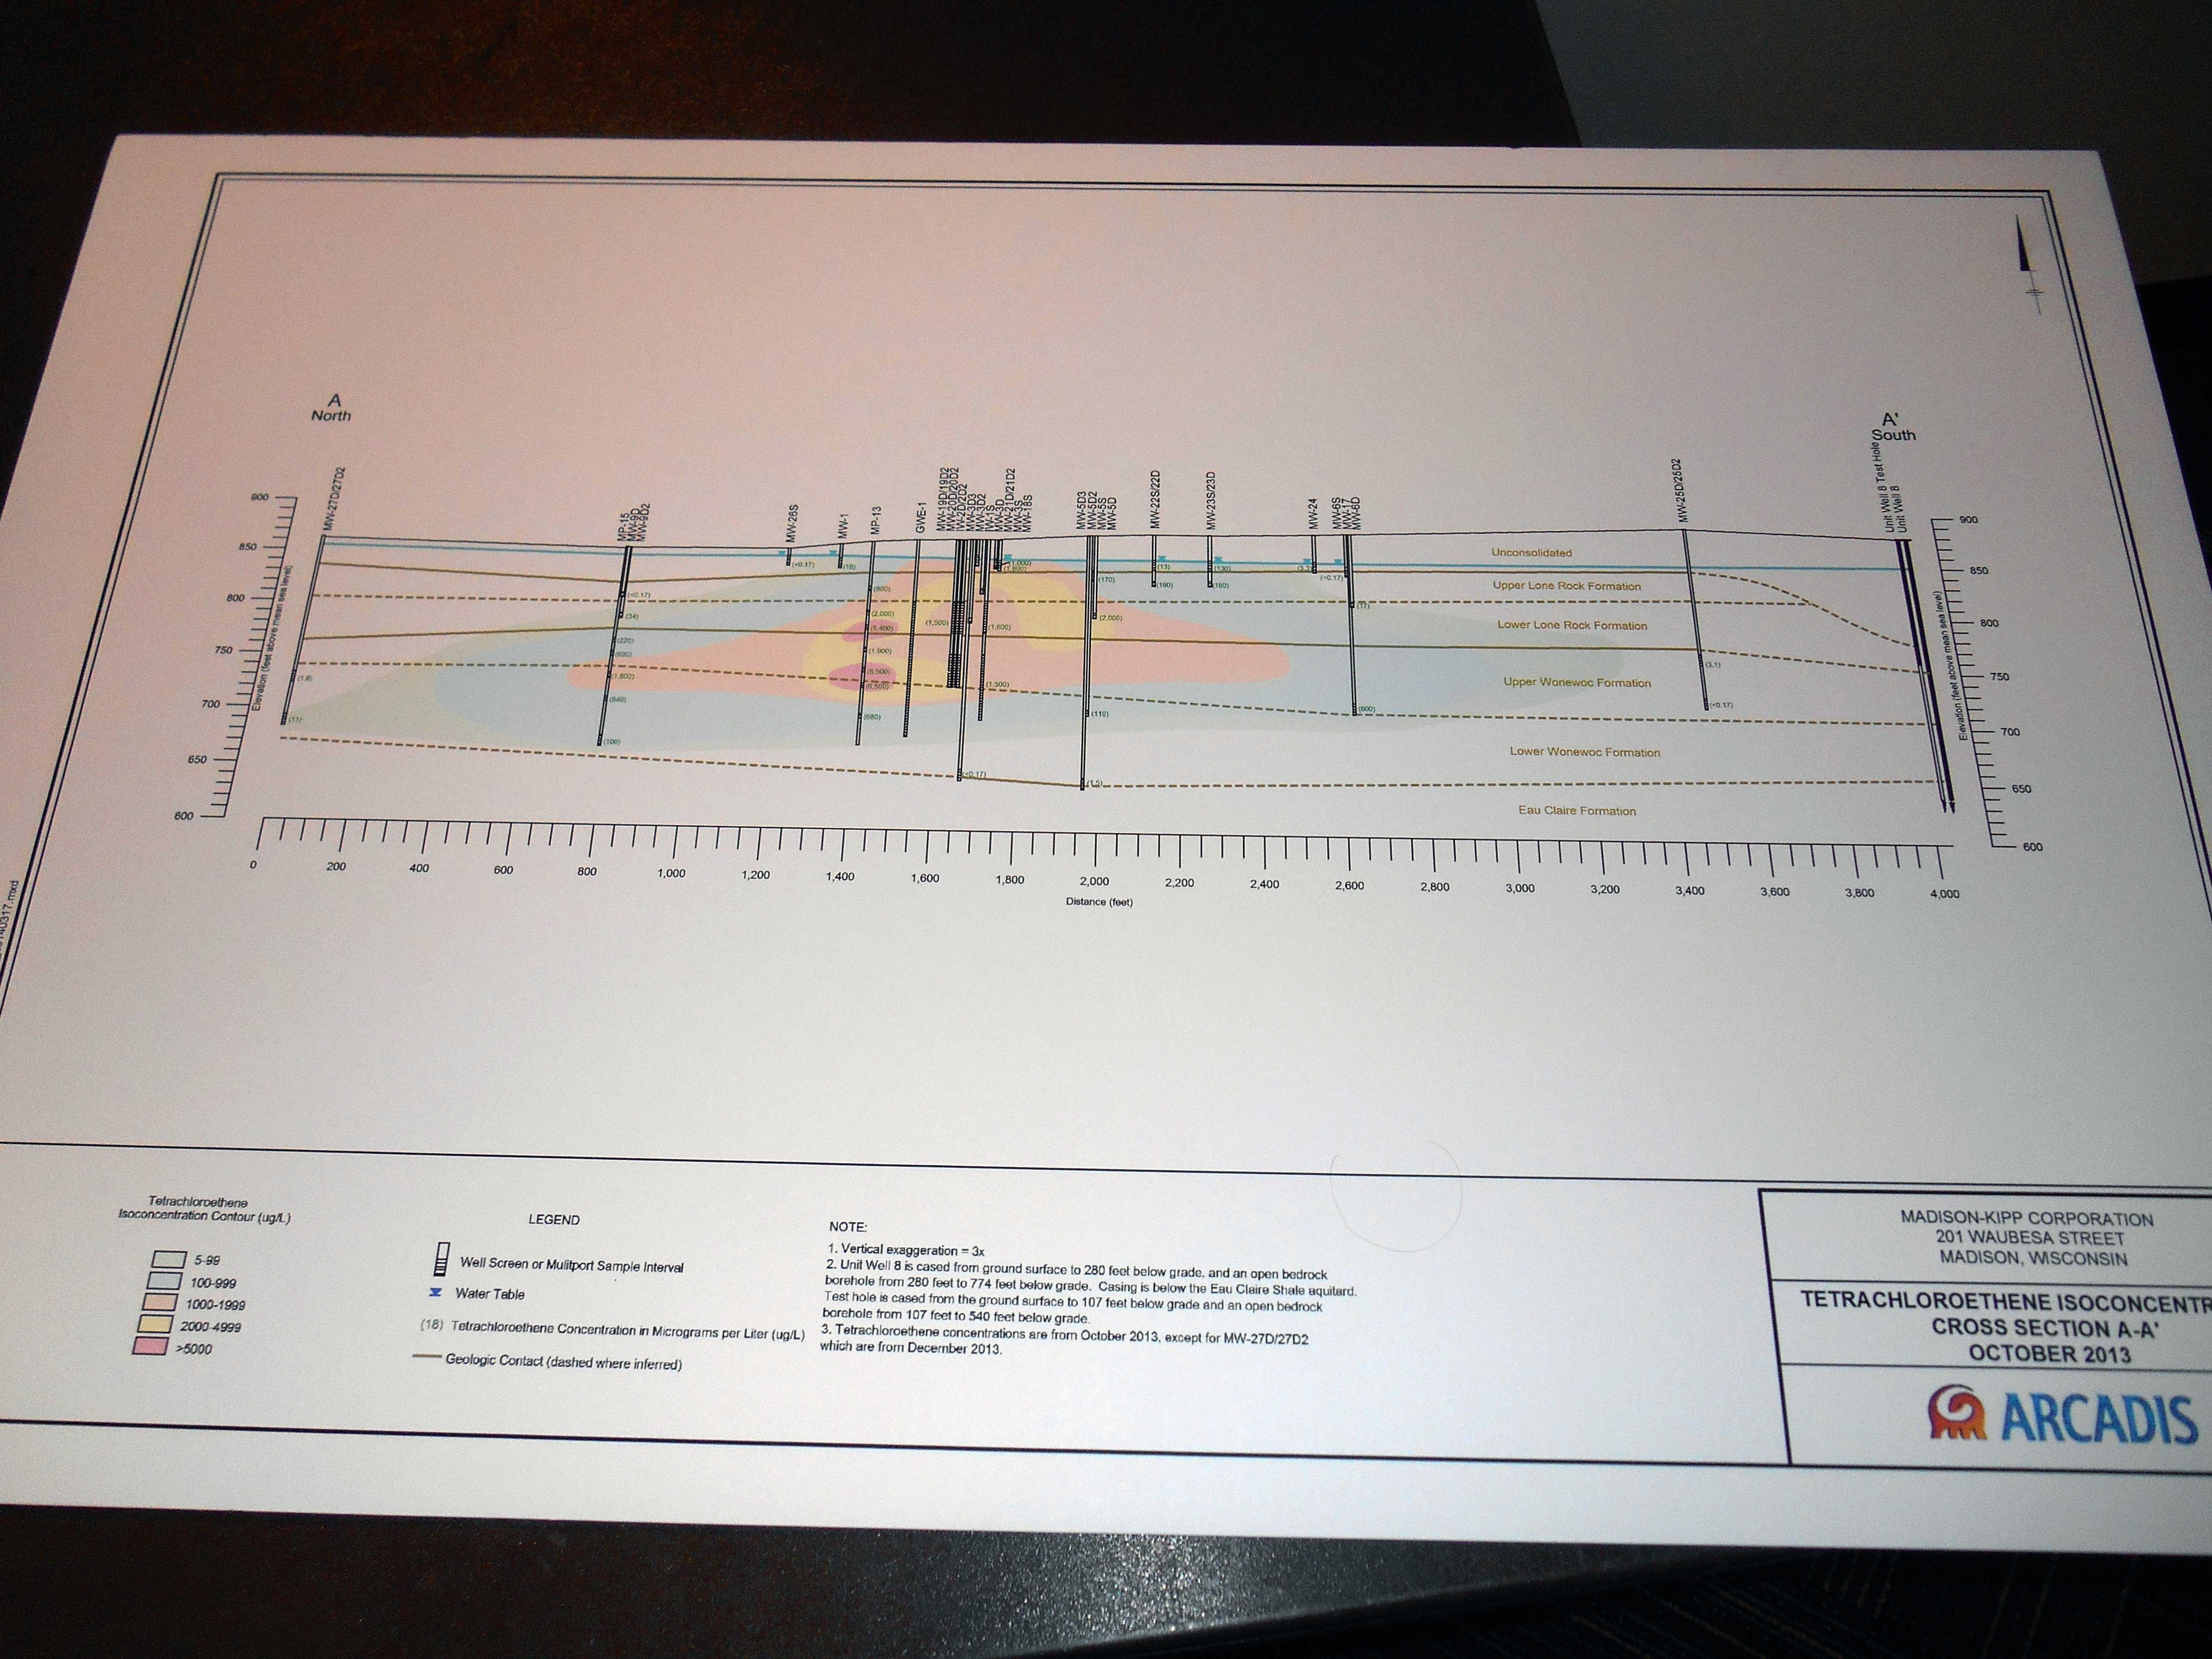
Before Mr. Koblinski turned the maps around, I had already snapped a photo of a north-south groundwater cross-section map dated October 2013, with the reluctant permission of the Arcadis consultants standing there. This map was also presented in Mr. Koblinski’s talk. Again, why was a map based on five-month old data not yet “ready for prime time”—and if it wasn’t ready, why was it presented at all? We don’t know, but have some speculations. Read on…
Respecting Mr. Koblinski’s request, I did not share the photos I took in March, but waited for the release of the Annual Report by the DNR on April 8, 2014. The report includes no data and no maps, and is devoid of specific information other than a summary of Arcadis activities in 2013. Though a separate electronic report released on April 8 includes groundwater data, none of the cross-section or other isoconcentration groundwater maps were posted on the DNR website.
I emailed DNR about the maps and was told that they were too big for Arcadis to send via email,[1] but hard copies of the maps were at Hawthorne library. DNR offered to ask Arcadis for a CD with the maps and make it available to me. I asked DNR to instead get the maps electronically from Arcadis and post them on the website so that any interested citizens can more easily access them.[2] DNR sent me a CD but has not posted the maps on their website for others to access (as of May 13).
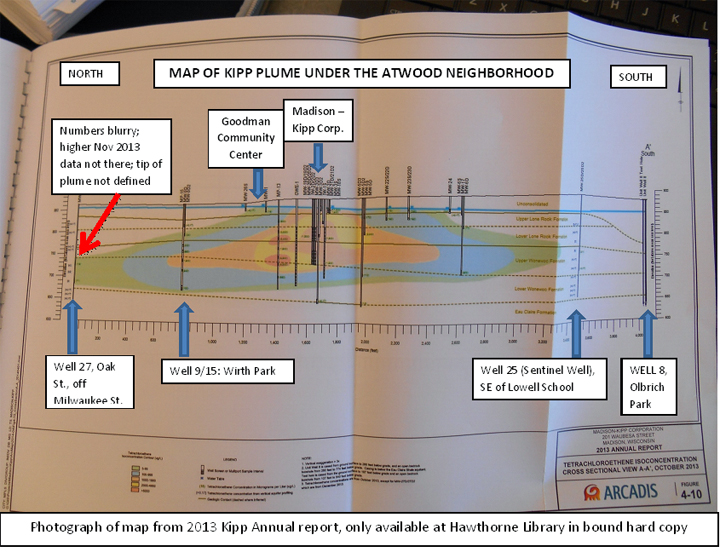
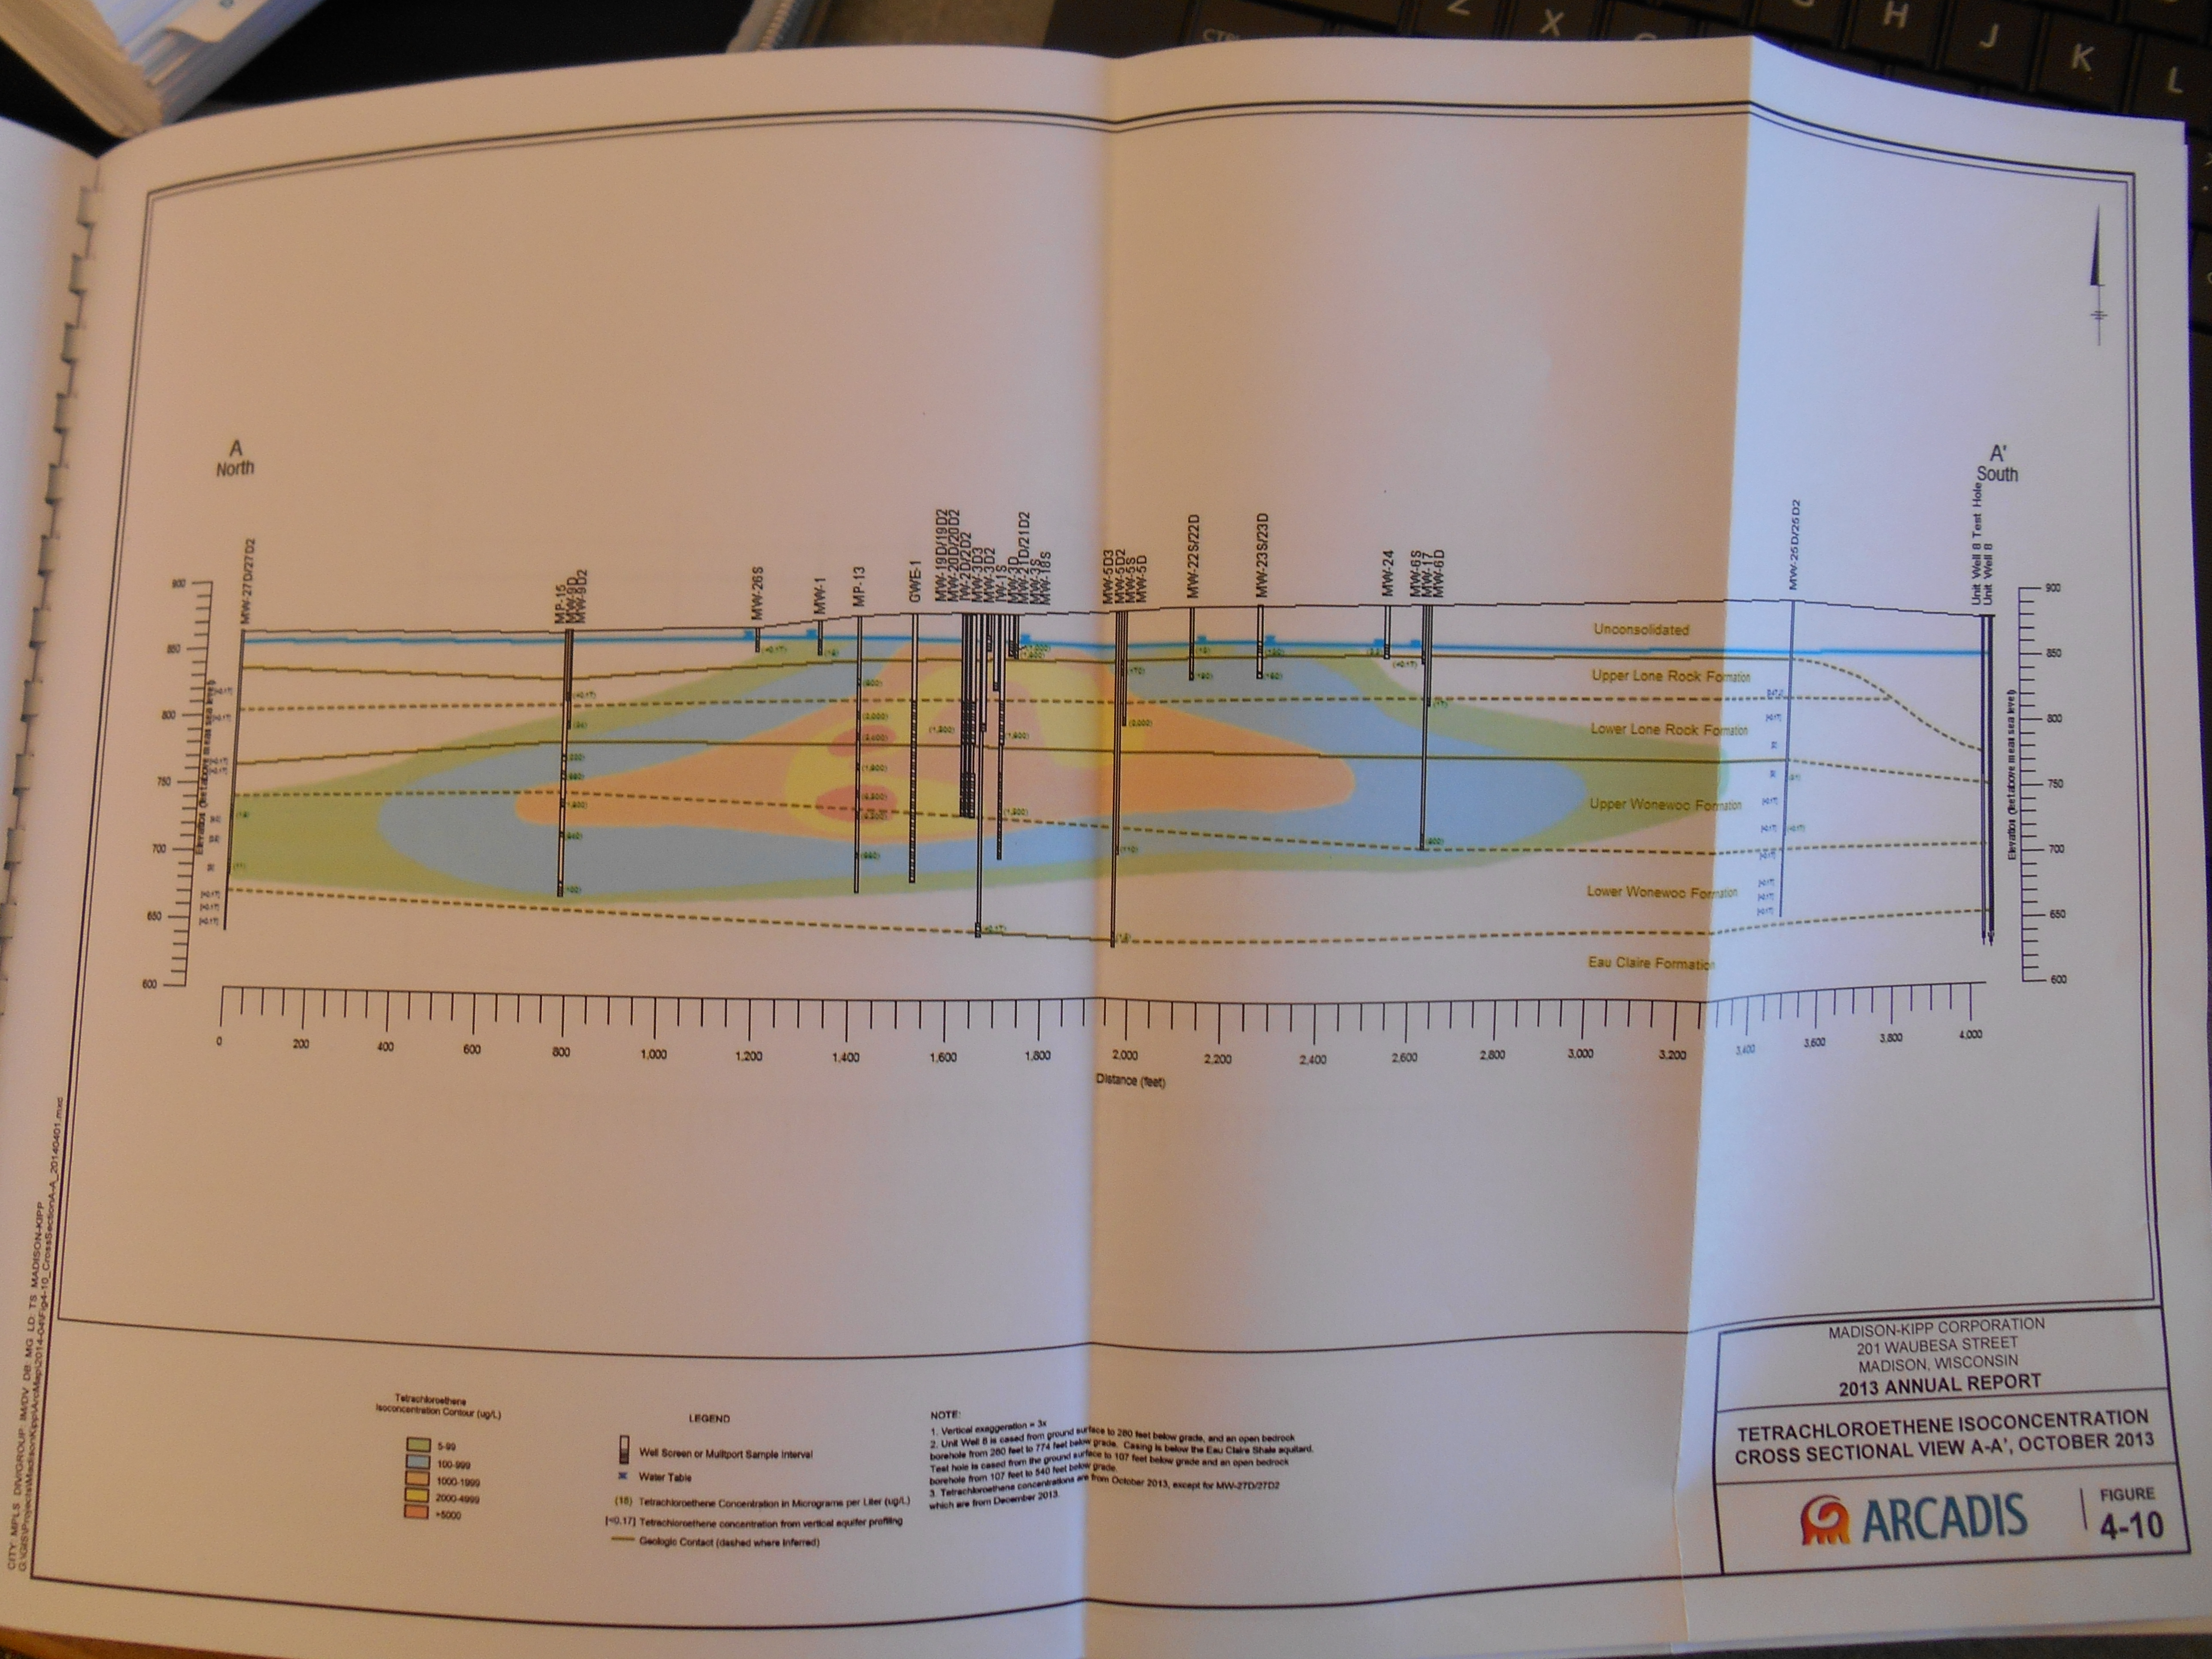
In the meantime, I went to Hawthorne library and found the maps in bound reports.[3] The October north-south cross-section plume map there has the same title and date as the one I photographed at the March 19 meeting. Though all the numbers on the map are blurry and nearly impossible to make out, those listed for the northernmost well (Well 27 off Milwaukee Street) appear to be the same as on the map I photographed after the March public meeting: 1.6 ug/L and 11 ug/L.
A Tale of Two Maps
Strangely, however, the shapes of the plumes on the two maps are slightly different—especially towards Well 27. The map presented at the March public meeting (in Part 2 of the presentation here) depicts the northern tip of the plume just barely reaching Well 27. The map included in the Annual Report at Hawthorne (also shown with captions above) while having the same title and date, and showing the same numbers (blurrily), clearly shows that the plume goes much further than Well 27 (off the map to the north) and is more substantial vertically at that well.
So presumably, the map actually included in the Annual Report, with the more significant vertical plume depicted at Well 27, was the one Kipp felt was “ready for prime time” while the earlier one wasn’t. But in fact, both maps are misleading because neither includes the actual vertical profiling contaminant levels from Well 27 in November 2013—levels that were much higher than the numbers written on the maps. These tests found PCE levels of 40 and 25 ug/L, and TCE levels of 22 and 16 ug/L at 135-145 feet and 150-160 feet (respectively), as well as significant levels of the breakdown product cis-1,2, dichloroethylene (DCE). Arcadis also identified a significant fracture at 140 feet deep in November—which would be a key preferential pathway for the contaminants to travel underground to the north.
Data Not Shared with Public or City of Madison
We know that DNR and Kipp knew about this vertical profiling data in mid-December 2013. Apparently, neither shared this important information with the City of Madison, and Mr. Koblinski didn’t share it with the public at the March 2014 meeting. In fact, he presented groundwater maps that omitted this data and depicted a plume that pretty much tapered off before reaching Well 27 (with just the tip of the plume at that well). Other isoconcentration maps he presented, which he didn’t allow us to photograph, also made it appear as if no contamination over the enforcement standard of 5 ug/L had ever been found at Well 27. Further, he didn’t mention the underground fractures Arcadis had located. Research shows that such fractures can act as “contaminant superhighways,” through which contaminants can travel quickly—and far away—from contaminant sources.
Instead, Mr. Koblinski said “most of the contamination is under the building footprint,” referring to the Kipp building. He noted that the contamination doesn’t go deeper than 170 feet, which is incorrect (see Arcadis tables linked to above). He declared that the Kipp plume “tends to flatten out…it gets weaker and weaker, it’s diluted, it diffuses into the bedrock, and Mother Nature, though wounded, begins to take care of it. It biodegrades, and over time, it cleans up.”
Troublingly, to support these absurd and scientifically incorrect statements, Kipp’s CEO showed the public misleading maps that omitted critical data. Moreover, he didn’t show some important maps at all—such as the map showing how far the plume may have traveled to the east and west of Kipp. More discussion about this below…
Deep Contamination Going North, or South…or Whatever Direction Kipp Wants it To Go?
Mr. Koblinski stated in his talk that “movement of groundwater is generally downward and predominantly to the south”—which contradicts data and maps above showing significant levels of contaminants in deep groundwater 1400 feet north of Kipp (and beyond). Kipp consultant reports have stated since the 1990s that the deep groundwater is moving north. Was Mr. Koblinski purposely trying to mislead the public, or was that a misstatement? Consultant reports also say repeatedly that shallow and intermediate-level groundwater around Kipp is going south/southeast/southwest. Perhaps Mr. Koblinski was confusing deep and shallow groundwater? Either way, this begs the question we have asked again and again over the last few years: If the shallow and mid-level groundwater is going south, why hasn’t there been any groundwater testing directly to the south and southwest of Kipp, and only limited testing to the southeast (Well 25)?
DNR Doesn’t Want to Know How Much Further North the Plume Has Gone Either? What About East & West?
According to the Annual Report, Kipp doesn’t plan to install any more groundwater monitoring wells—not even to the north of Well 27 at Oak St/Milwaukee Street, where the contaminant levels are well above enforcement standards and the tip of the plume has clearly not been defined. DNR doesn’t plan to ask Kipp to install another monitoring well further north of Well 27.
The extent of the Kipp plume to the east and west of the plant, not discussed at all at the March 19 meeting, has also not been defined. Contaminant levels found in October 2013 at Monitoring Wells 14 and 16 (approximately 450 feet west and east of Kipp, respectively) are orders of magnitude above the enforcement standards (the depictions of the east-west extents of the plume in this map are Kipp consultants’ estimations—there is no actual monitoring data to back this up as far as we know). The extent of the plume to the west is of particular concern, since Well 14, to the west of Kipp, has levels of up to 970 ug/L PCE at 135-145 feet and 640 ug/L at 170-178 feet. Levels of TCE and DCE are also substantial at these depths.
So…how far does the plume go to the north? To the south, east, and west? If no more wells will be installed, we’ll never know how wide and deep the plume is—until contaminants show up in one or more of our drinking water wells. Perhaps they already have? As noted above, plumes can travel several miles from the source in preferential pathways such as underground fractures. Several Water Utility wells on north/east sides of Madison within five miles from Kipp (Well 11, Well 15, Well 8, Well 9) already have had some PCE, TCE, and/or DCE contamination for some time. Could any of this contamination have come from Kipp? It’s possible, given that the plume has been traveling deep underground through fractures and other pathways since the late 1940s, and several drinking water wells in a few mile radius around Kipp have been pulling the contaminant plume around in various directions–depending on which wells were used (or not), when, and how much they were pumping (see later story).
Some of our analysis is preliminary, since we don’t have access to all of the information. Regardless, one thing seems pretty clear based on our experiences and the information we have been able to piece together: Kipp doesn’t want people to know how far north the plume has reached, and at what levels.
Lacking maps, to help visualize how wide and deep the plume might be in groundwater under the neighborhood, we put together a very rough map based only on the most recent data from the furthest offsite wells (October 2013 for Wells 14, 15 16, 25, and November-December 2013 for Well 27), summarized below—so people could see the extent of the plume at this point.[4]
[1] Arcadis has provided countless maps and diagrams to DNR in electronic form in the past couple years to post online. Why are they unable to do so for these figures?
[2] Many people cannot go to Hawthorne Library and/or cannot afford to copy these maps.
[3] The maps cannot be easily photocopied (they are large and an awkward size in bound reports). Photographs I took are not clear because the maps are creased from folding.
[4] To keep it simple, data from all depths were combined for each contaminant.
Summary below of most recent data from:https://mejo.us/wp-content/uploads/2014/05/arcadisTables1213.pdf
FAR NORTH (Well 27, off Milwaukee St.)(November 2013 data is vertical profiling data)
11/24—135-145 feet: PCE 40ug/L, TCE 22ug/L, cis-1,2-DCE 13 ug/L
11/25—150-160 feet: PCE 25ug/L, TCE 16ug/L, cis-1,2-DCE8 ug/L
11/25—160-170 feet: PCE 3 ug/L, TCE 1 ug/L, cis-1,2-DCE .47 ug/L
12/26—130-140 feet: PCE 1.8ug/L, TCE 1.3ug/L, cis-1,2-DCE .85 ug/L
12/26—170-180 feet: PCE 11ug/L, TCE 7.2ug/L, cis-1,2-DCE4 ug/L
NORTH (Wells 9/15 Wirth Park)***
10/4/13–64-69 feet: 34 ug/L, TCE 7.4, cis-1,2 DCE 18 (Well 9, all the rest from Well 15)
10/8/13—PCE, 88-92 feet: 220 ug/L, TCE, 19 ug/L, cis-1, 3 DCE 20 ug/L
10/8/13—PCE, 100-105 feet: PCE 690ug/L, TCE 72ug/L, cis-1, 2 DCE 76 ug/L
10/8/13—PCE, 120-125 feet: PCE 1800ug/L, TCE 190ug/L, cis-1, 2 DCE 220 ug/L
10/8/13—PCE, 142-146 feet: PCE 840ug/L, TCE 130ug/L, cis-1, 2 DCE 140 ug/L, vinyl chloride .76 ug/L
10/8/13—PCE, 177-187 feet: PCE 100ug/L, TCE 12ug/L, cis-1, 2 DCE 16ug/L, vinyl chloride .34 ug/L
***Well 9 was the original, shallower well. Well 15 was installed later, and is a deeper well. They are right next to each other at the same location.
EAST (Well 16, corner of Dixon and Fairview)
10/9/13—PCE, 80-84 feet—.76ug/L, rest below detection limits
10/9/13—PCE, 106-116 feet—94ug/L, TCE 13ug/L, cis-1, 2 DCE 10 ug/L
10/9/13—PCE, 140-144 feet—37ug/L, TCE 6.1ug/L
10/9/13—PCE, 175-179 feet—3.7ug/L, TCE .98ug/L
WEST (Well 14, just off Corry St.)
10/8/13—70-75 feet, all below detection limits
10/8/14—100-105 feet, 1.7 ug/L PCE
10/8/13—PCE, 135-145 feet—970ug/L, TCE 53ug/L, cis-1, 2 DCE 27 ug/L, vinyl chloride, .53 ug/L
10/8/13—PCE, 170-178 feet—640ug/L, TCE 37ug/L, cis-1, 2 DCE 22 ug/L
SOUTHEAST (Well 25, southeast of Lowell School, sentinel well for Well 8)***
10/9/13—PCE, 120-130 feet—3.1ug/L, MC 5.3ug/L
10/4/13– PCE, 160-170 feet—all under detection limits
***This data is also too limited in time and depths to say yet what is happening at this well. There have only been three sets of tests at two depths on this well. The last set of tests, in October 2013 (shown above) showed the highest levels of PCE and methylene chloride of the three tests. Methylene chloride levels were well over the Preventive Action Limit and slightly over the Enforcement Standard. PCE was not far under the Enforcement Standard. Far more tests at different depths need to be done on this well before drawing conclusion about how far and deep the plume is at the sentinel well.
Well 26S, (Goodman Parking Lot)***
8/23/13—PCE, 6.8-16.8 feet: PCE 1.4 ug/L, rest below detection limits
10/9/13—all below detection limits
***These results (from only two dates at only one narrow range of depths) aren’t remotely adequate to assess what is beneath the Goodman property in groundwater, nor does it tell us anything about potential vapor intrusion problems inside the Goodman Center, which is the most important issue to assess as far as risks to people there. To assess risks to people there, vapor tests need to be done in the subslab of the center and in indoor air. Yet Mr Koblinski said during his March 19 2013 presentation that Well 26S results confirm that there are no vapor problems on the Goodman property. To draw this conclusion from this limited data is scientifically inadequate and, moreover, highly unethical from a public health standpoint given that many at-risk children and elderly spend a lot of time at this center.
Preventive Action Limit (PAL):
Tetrachloroethylene (PCE)–.5 ug/L
Trichloroethylene (TCE)–.5 ug/L
Cis- 1, 2-dichloroethylene (DCE)—7ug/L
Vinyl chloride (VC)–.02 ug/L
Methylene chloride (MC)–.5 ug/L
Enforcement Standard (ES):
Tetrachloroethylene (PCE)–5 ug/L
Trichloroethylene (TCE)–5 ug/L
Cis- 1, 2-dichloroethylene (DCE)—70 ug/L
Vinyl chloride (VC)–.2 ug/L
Methylene chloride (MC)—5 ug/L
